
Landslide Upslope Downslope Factors

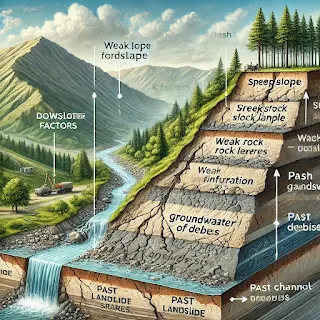
Landslides occur when the driving forces (gravity, water saturation, seismic activity) exceed the resisting forces (cohesion, friction, vegetation cover) on a slope. To understand landslide dynamics, we classify contributing factors into:

  1. Upslope Factors – Conditions on the upper part of the slope that contribute to instability.
  2. Downslope Factors – Conditions at the base that further exacerbate landslides, often by removing support or altering water flow.

1. Upslope Factors

(a) Steep Slope Angle (Gradient Effect)

  • A higher slope gradient increases shear stress, making the slope more susceptible to failure.
  • Angle of Repose: The maximum angle at which a material remains stable; exceeding this angle leads to landslides.
  • Example: The Himalayan region has high landslide risks due to steep slopes and tectonic activity.

(b) Weak Soil or Rock Type

  • Lithology (rock type) determines slope strength.
  • Clay-rich soils (e.g., montmorillonite) expand when wet, reducing stability.
  • Weathered rocks (e.g., shale, phyllite) lose cohesion over time.
  • Example: Western Ghats experience landslides in lateritic soils after monsoon rains.

(c) Vegetation Cover

  • Roots reinforce soil and absorb excess water.
  • Deforestation increases erosion and runoff.
  • Example: Amazon Basin has stable slopes due to dense tree cover, while Haiti suffers from deforestation-induced landslides.

(d) Water Saturation (Pore Water Pressure Effect)

  • Hydrostatic pressure increases soil weight and reduces internal friction.
  • Infiltration capacity varies; sandy soils drain better than clayey soils.
  • Example: Uttarakhand floods (2013) triggered landslides due to excessive rainfall.

(e) Joints and Fissures

  • Geological discontinuities (faults, bedding planes, joints) act as failure planes.
  • Example: The San Andreas Fault in California increases landslide risks due to active tectonics.

(f) Human Disturbances

  • Construction (roads, dams) alters load distribution.
  • Mining induces vibrations and weakens slopes.
  • Example: The Malin landslide (Maharashtra, India, 2014) was worsened by hill cutting for agriculture.

2. Downslope Factors

(a) Erosion at the Base

  • Undercutting by rivers, waves, or glaciers removes slope support.
  • Example: Konkan coast, India experiences coastal landslides due to wave erosion.

(b) Changes in Water Table

  • High groundwater levels increase pore pressure and reduce cohesion.
  • Example: Oso landslide (Washington, USA, 2014) was linked to high water table changes.

(c) Steep Channel Gradients

  • Accelerated water flow scours the base, destabilizing the slope.
  • Example: Teesta River valley, Sikkim has landslide-prone zones due to steep stream gradients.

(d) Presence of Debris

  • Accumulated sediments create barriers, leading to sudden failures.
  • Example: Landslide dams in Nepal Himalayas cause flash floods when breached.

(e) Previous Landslide Activity

  • Remobilization of old debris increases future risks.
  • Example: Darjeeling region experiences recurring landslides due to historical instability.
  • Interplay Between Factors: Upslope and downslope factors often act together.
  • Mitigation Strategies:
    • Upslope: Reforestation, slope drainage, terracing.
    • Downslope: Retaining walls, river training, landslide barriers.
  • GIS-Based Risk Mapping: Combining remote sensing and Digital Elevation Models (DEM) helps in hazard prediction.

Comments

Popular posts from this blog

History of GIS

1. 1832 - Early Spatial Analysis in Epidemiology:    - Charles Picquet creates a map in Paris detailing cholera deaths per 1,000 inhabitants.    - Utilizes halftone color gradients for visual representation. 2. 1854 - John Snow's Cholera Outbreak Analysis:    - Epidemiologist John Snow identifies cholera outbreak source in London using spatial analysis.    - Maps casualties' residences and nearby water sources to pinpoint the outbreak's origin. 3. Early 20th Century - Photozincography and Layered Mapping:    - Photozincography development allows maps to be split into layers for vegetation, water, etc.    - Introduction of layers, later a key feature in GIS, for separate printing plates. 4. Mid-20th Century - Computer Facilitation of Cartography:    - Waldo Tobler's 1959 publication details using computers for cartography.    - Computer hardware development, driven by nuclear weapon research, leads to broader mapping applications by early 1960s. 5. 1960 - Canada Geograph...

Accuracy Assessment

Accuracy assessment is the process of checking how correct your classified satellite image is . 👉 After supervised classification, the satellite image is divided into classes like: Water Forest Agriculture Built-up land Barren land But classification is done using computer algorithms, so some areas may be wrongly classified . 👉 Accuracy assessment helps to answer this question: ✔ "How much of my classified map is correct compared to real ground conditions?"  Goal The main goal is to: Measure reliability of classified maps Identify classification errors Improve classification results Provide scientific validity to research 👉 Without accuracy assessment, a classified map is not considered scientifically reliable . Reference Data (Ground Truth Data) Reference data is real-world information used to check classification accuracy. It can be collected from: ✔ Field survey using GPS ✔ High-resolution satellite images (Google Earth etc.) ✔ Existing maps or survey reports 🧭 Exampl...

Supervised Classification

Image Classification in Remote Sensing Image classification in remote sensing involves categorizing pixels in an image into thematic classes to produce a map. This process is essential for land use and land cover mapping, environmental studies, and resource management. The two primary methods for classification are Supervised and Unsupervised Classification . Here's a breakdown of these methods and the key stages of image classification. 1. Types of Classification Supervised Classification In supervised classification, the analyst manually defines classes of interest (known as information classes ), such as "water," "urban," or "vegetation," and identifies training areas —sections of the image that are representative of these classes. Using these training areas, the algorithm learns the spectral characteristics of each class and applies them to classify the entire image. When to Use Supervised Classification:   - You have prior knowledge about the c...

Development and scope of Environmental Geography and Recent concepts in environmental Geography

Environmental Geography studies the relationship between humans and nature in a spatial (place-based) way. It combines Physical Geography (natural processes) and Human Geography (human activities). A. Early Stage 🔹 Environmental Determinism Concept: Nature controls human life. Meaning: Climate, landforms, and soil decide how people live. Example: People in deserts (like Sahara Desert) live differently from people in fertile river valleys. 🔹 Possibilism Concept: Humans can modify nature. Meaning: Environment gives options, but humans make choices. Example: In dry areas like Rajasthan, people use irrigation to grow crops. 👉 In this stage, geography was mostly descriptive (explaining what exists). B. Evolution Stage (Mid-20th Century) Environmental problems increased due to: Industrialization Urbanization Deforestation Pollution Geographers started studying: Environmental degradation Resource management Human impact on ecosystems The field became analytical and problem-solving...

GIS: Real World and Representations - Modeling and Maps

Geographic Information Systems (GIS) serve as a bridge between the real world and digital representations of geographic phenomena. These representations allow users to store, analyze, and visualize spatial data for informed decision-making. Two key aspects of GIS in this context are modeling and maps , both of which are used to represent real-world geographic features and phenomena in a structured, analyzable format. Let's delve into these concepts, terminologies, and examples in detail. 1. Real World and Representations in GIS Concept: The real world comprises physical, tangible phenomena, such as landforms, rivers, cities, and infrastructure, as well as more abstract elements like weather patterns, population densities, and traffic flow. GIS allows us to represent these real-world phenomena digitally, enabling spatial analysis, decision-making, and visualization. The representation of the real world in GIS is achieved through various models and maps , which simplify...