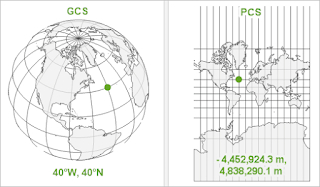
Geographic Coordinate System (GCS)
A Geographic Coordinate System (GCS) uses a three-dimensional spherical surface to define locations on Earth. It is based on a datum, an ellipsoid, and angular units (latitude and longitude).
Key Components of GCS:
- Latitude (ϕ): Measures the north-south position relative to the Equator (0°). It ranges from 90°N to 90°S.
- Longitude (λ): Measures the east-west position relative to the Prime Meridian (0°). It ranges from 180°E to 180°W.
- Datum: Defines the reference ellipsoid and origin point.
- Ellipsoid: An approximation of the Earth's shape.
- Geoid: A model of Earth's gravitational surface.
Example of a Geographic Coordinate System:
- WGS 84 (World Geodetic System 1984) – Used in GPS and global mapping applications.
Advantages of GCS:
- Accurately represents global locations.
- Commonly used for spatial data storage and sharing.
Disadvantages of GCS:
- Distances and areas are distorted because the Earth is not a perfect sphere.
- Not ideal for detailed, local mapping due to distortions in scale.
Projected Coordinate System (PCS)
A Projected Coordinate System (PCS) is a two-dimensional representation of Earth's surface created by mathematically transforming the curved surface of the Earth onto a flat plane.
Key Components of PCS:
- Projection Type: Defines how the Earth's surface is transformed.
- X, Y Coordinates: Express positions in meters or feet instead of latitude and longitude.
- Origin and Datum: Ensures projection accuracy.
Types of Projections in PCS:
- Conformal Projection: Preserves shape but distorts area (e.g., Mercator projection).
- Equal-Area Projection: Maintains area but distorts shape (e.g., Albers Equal-Area).
- Equidistant Projection: Preserves distances along specific lines (e.g., Plate Carrée).
- Azimuthal Projection: Maintains direction but distorts distance (e.g., Lambert Azimuthal Equal Area).
Example of a Projected Coordinate System:
- UTM (Universal Transverse Mercator): Divides the world into 60 zones, each 6° wide.
- State Plane Coordinate System (SPCS): Used for high-accuracy local mapping in the U.S.
Advantages of PCS:
- Preserves distances and areas, making it ideal for local and regional mapping.
- Allows for easier measurements and calculations in GIS.
Disadvantages of PCS:
- Distortion increases when used for large-scale or global mapping.
- Different projections may be required for different regions.
Datums in GIS
A datum is a mathematical model that defines the size, shape, and orientation of the Earth for mapping and surveying purposes.
Types of Datums:
A. Geodetic Datums (Horizontal Datums)
Used for positioning locations on the Earth's surface.
-
Global Datums:
- WGS 84: Used in GPS and most global applications.
- ITRF (International Terrestrial Reference Frame): Used for scientific measurements.
-
Local Datums:
- NAD 27 (North American Datum 1927): Based on Clarke 1866 Ellipsoid, used in North America.
- NAD 83 (North American Datum 1983): Updated to align with modern satellite data.
B. Vertical Datums
Used for measuring elevations and depths.
-
Geoid-Based:
- EGM96 (Earth Gravitational Model 1996): Used for global height measurements.
- NAVD88 (North American Vertical Datum 1988): Used in North America.
-
Ellipsoid-Based:
- WGS 84 Ellipsoid Height: Used in GPS applications.
Example:
- A point in New York City might have different coordinates in WGS 84 versus NAD 83 due to differences in datum definitions.
Ellipsoid and Geoid in GIS
These are models of Earth's shape used in geodesy and GIS.
Ellipsoid
- A mathematically defined smooth surface that approximates the shape of the Earth.
- Used in map projections and coordinate systems.
- Example: GRS 80 (Geodetic Reference System 1980), WGS 84.
Geoid
- Represents the actual shape of the Earth based on gravity measurements.
- More accurate for elevation measurements than ellipsoids.
- Example: EGM2008 (Earth Gravitational Model 2008).
Key Differences:
| Feature | Ellipsoid | Geoid |
|---|---|---|
| Definition | Smooth mathematical model of Earth | Realistic Earth shape based on gravity |
| Purpose | Used for mapping and coordinate systems | Used for measuring precise elevations |
| Example | WGS 84, GRS 80 | EGM96, NAVD88 |
Example in GIS:
- GPS uses an ellipsoid model (WGS 84) for positioning.
- Elevation data often references the geoid (EGM96) for height measurements.
- GCS (Latitude-Longitude) is best for global positioning but introduces distortions.
- PCS (Projected X-Y coordinates) is ideal for precise local measurements.
- Datums define how coordinates align with Earth's shape.
- Ellipsoids approximate Earth's smooth shape, while geoids account for gravitational variations.
Practical Applications in GIS:
- GPS Navigation: Uses WGS 84 for positioning.
- Land Surveys: Use local datums like NAD 83 for high-accuracy mapping.
- Elevation Mapping: Uses geoid-based vertical datums for terrain analysis.
- Urban Planning: Uses UTM projections for detailed city mapping.
Comments
Post a Comment