
Maps Spatial Information


Concepts

  1. Map: A map is a visual representation of an area that depicts the spatial distribution of features such as landscapes, urban infrastructure, or natural resources. Maps use symbols, colors, and scales to simplify and display real-world data.

  2. Spatial Information: Spatial information refers to data about the location, shape, size, and relationships of physical objects or phenomena on Earth. It is often georeferenced, meaning it is tied to specific coordinates (latitude and longitude).

  3. Geographic Information Systems (GIS): GIS is a framework that allows for the capture, storage, manipulation, analysis, and visualization of spatial information. It integrates maps with datasets to reveal patterns, relationships, and trends.


Key Terminologies

  1. Coordinates: A system of numbers (e.g., latitude and longitude) used to define the exact location of a point on the Earth's surface.

    • Example: 37.7749° N, 122.4194° W (San Francisco, USA).
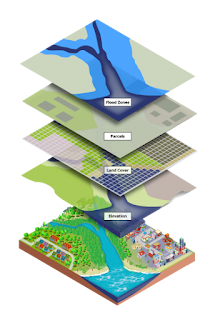
  2. Layers: In GIS, a layer represents a specific type of spatial information (e.g., roads, rivers, or population density), which can be overlaid on a map.

  3. Attributes: Non-spatial data linked to spatial features. For example, a road feature may have attributes such as name, type, and width.

  4. Thematic Maps: Maps focused on a specific theme, such as climate zones or crime rates.

  5. Projections: Mathematical transformations that convert the Earth's 3D surface into a 2D map. Examples include Mercator projection and Lambert conformal conic projection.

  6. Scale: The ratio of a distance on the map to the actual distance on the ground. For instance, a 1:50,000 scale means 1 unit on the map represents 50,000 units in reality.


Examples

  1. Navigation Maps: Google Maps is a common example, displaying roads, buildings, and landmarks with turn-by-turn directions.

  2. Thematic Analysis: A land use map showing areas of urbanization, agriculture, forest cover, and water bodies to understand human impact on the environment.

  3. Environmental Monitoring: Using GIS, researchers can map forest fires to identify affected areas and proximity to communities.

  4. Disaster Management: Flood risk maps integrate rainfall data, terrain elevation, and population density to guide evacuation planning.


Importance of Maps and Spatial Information

  1. Urban Planning: Identifying optimal locations for infrastructure development (e.g., schools or hospitals).

  2. Environmental Conservation: Tracking deforestation or monitoring wildlife habitats.

  3. Agriculture: Mapping soil types and rainfall patterns to enhance crop yield predictions.

  4. Disaster Response: Providing real-time data on hazards like earthquakes or hurricanes.


By combining maps with spatial information, we gain a powerful tool to analyze geographic data, solve complex problems, and visualize relationships that are otherwise hard to interpret. Tools like GIS elevate this process, enabling precise decision-making in diverse fields such as urban planning, disaster management, and environmental conservation.

Comments

Popular posts from this blog

REMOTE SENSING INDICES

Remote sensing indices are band ratios designed to highlight specific surface features (vegetation, soil, water, urban areas, snow, burned areas, etc.) using the spectral reflectance properties of the Earth's surface. They improve classification accuracy and environmental monitoring. 1. Vegetation Indices NDVI – Normalized Difference Vegetation Index Formula: (NIR – RED) / (NIR + RED) Concept: Vegetation reflects strongly in NIR and absorbs in RED due to chlorophyll. Measures: Vegetation greenness & health Uses: Agriculture, drought monitoring, biomass estimation EVI – Enhanced Vegetation Index Formula: G × (NIR – RED) / (NIR + C1×RED – C2×BLUE + L) Concept: Corrects for soil and atmospheric noise. Measures: Vegetation vigor in dense canopies Uses: Tropical rainforest mapping, high biomass regions GNDVI – Green Normalized Difference Vegetation Index Formula: (NIR – GREEN) / (NIR + GREEN) Concept: Uses Green instead of Red ...

Atmospheric Window

The atmospheric window in remote sensing refers to specific wavelength ranges within the electromagnetic spectrum that can pass through the Earth's atmosphere relatively unimpeded. These windows are crucial for remote sensing applications because they allow us to observe the Earth's surface and atmosphere without significant interference from the atmosphere's constituents. Key facts and concepts about atmospheric windows: Visible and Near-Infrared (VNIR) window: This window encompasses wavelengths from approximately 0. 4 to 1. 0 micrometers. It is ideal for observing vegetation, water bodies, and land cover types. Shortwave Infrared (SWIR) window: This window covers wavelengths from approximately 1. 0 to 3. 0 micrometers. It is particularly useful for detecting minerals, water content, and vegetation health. Mid-Infrared (MIR) window: This window spans wavelengths from approximately 3. 0 to 8. 0 micrometers. It is valuable for identifying various materials, incl...

Landsat band composition

Short-Wave Infrared (7, 6 4) The short-wave infrared band combination uses SWIR-2 (7), SWIR-1 (6), and red (4). This composite displays vegetation in shades of green. While darker shades of green indicate denser vegetation, sparse vegetation has lighter shades. Urban areas are blue and soils have various shades of brown. Agriculture (6, 5, 2) This band combination uses SWIR-1 (6), near-infrared (5), and blue (2). It's commonly used for crop monitoring because of the use of short-wave and near-infrared. Healthy vegetation appears dark green. But bare earth has a magenta hue. Geology (7, 6, 2) The geology band combination uses SWIR-2 (7), SWIR-1 (6), and blue (2). This band combination is particularly useful for identifying geological formations, lithology features, and faults. Bathymetric (4, 3, 1) The bathymetric band combination (4,3,1) uses the red (4), green (3), and coastal bands to peak into water. The coastal band is useful in coastal, bathymetric, and aerosol studies because...

Landsat 8 Band designation and Band Combination.

Landsat 8 Band designation and Band Combination.  Landsat 8-9 Operational Land Imager (OLI) and Thermal Infrared Sensor (TIRS) Bands Wavelength (micrometers) Resolution (meters) Band 1 - Coastal aerosol 0.43-0.45 30 Band 2 - Blue 0.45-0.51 30 Band 3 - Green 0.53-0.59 30 Band 4 - Red 0.64-0.67 30 Band 5 - Near Infrared (NIR) 0.85-0.88 30 Band 6 - SWIR 1 1.57-1.65 30 Band 7 - SWIR 2 2.11-2.29 30 Band 8 - Panchromatic 0.50-0.68 15 Band 9 - Cirrus 1.36-1.38 30 Band 10 - Thermal Infrared (TIRS) 1 10.6-11.19 100 Band 11 - Thermal Infrared (TIRS) 2 11.50-12.51 100 Vineesh V Assistant Professor of Geography, Directorate of Education, Government of Kerala. https://www.facebook.com/Applied.Geography http://geogisgeo.blogspot.com

Scattering

Scattering