
Radiometric correction

Radiometric correction in remote sensing is a crucial process that aims to remove or reduce variations in the recorded radiance values of an image, ensuring that the data accurately represents the reflectance properties of the Earth's surface. This correction is essential for extracting meaningful information from remotely sensed imagery.


1. Source of Radiometric Error:

   Radiometric errors in remote sensing can originate from various sources, including:


   a. Atmospheric Effects: The Earth's atmosphere can scatter and absorb incoming sunlight and reflected light from the surface. These atmospheric effects can introduce errors in radiance values, particularly in the blue and ultraviolet spectral regions.


   b. Sensor Characteristics: Different sensors have varying spectral and radiometric characteristics, leading to inconsistencies in radiance measurements.


   c. Satellite Orbits: Variations in the satellite's position, speed, and angle relative to the Earth's surface can affect the radiance recorded by the sensor.


   d. Ground Reflectance Variations: Changes in ground cover, terrain, and surface properties can result in varying reflectance values across an image.


   e. Calibration Issues: Sensor calibration drift over time or inaccuracies in the calibration process can introduce radiometric errors.


2. Types of Radiometric Correction:

   There are several methods for radiometric correction in remote sensing, depending on the specific sources of error and the data characteristics. Here are some common types:


   a. Dark Object Subtraction (DOS): This method involves identifying the darkest objects in the image, which are assumed to be black, non-reflective surfaces. The radiance values of all pixels are adjusted based on the radiance of these dark objects to correct for sensor-specific errors.


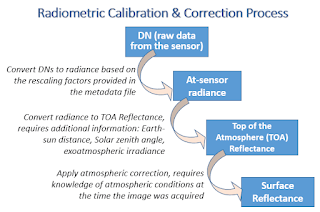
   b. Atmospheric Correction: Atmospheric correction algorithms attempt to estimate and remove the influence of the atmosphere on radiance values. They use atmospheric models and sensor data to adjust the recorded values to approximate surface reflectance.


   c. Calibration Correction: This correction addresses sensor-specific errors by using calibration data to rescale and adjust the recorded radiance values.


   d. Relative Radiometric Correction: In this approach, image-to-image variations are corrected by comparing and normalizing radiance values across different scenes or time periods.


   e. Absolute Radiometric Correction: This method aims to provide accurate radiometric values by considering sensor-specific parameters and calibration data, making the data directly comparable across different sensors and time periods.


   f. Top-of-Atmosphere (TOA) Reflectance: TOA reflectance correction calculates the reflectance values at the top of the atmosphere by removing atmospheric effects. This correction is valuable for comparing images acquired under varying atmospheric conditions.


Effective radiometric correction enhances the utility of remote sensing data for applications such as land cover classification, change detection, and environmental monitoring, by ensuring that the imagery accurately reflects the Earth's surface properties while minimizing errors caused by various sources.

Comments

Popular posts from this blog

Accuracy Assessment

Accuracy assessment is the process of checking how correct your classified satellite image is . 👉 After supervised classification, the satellite image is divided into classes like: Water Forest Agriculture Built-up land Barren land But classification is done using computer algorithms, so some areas may be wrongly classified . 👉 Accuracy assessment helps to answer this question: ✔ "How much of my classified map is correct compared to real ground conditions?"  Goal The main goal is to: Measure reliability of classified maps Identify classification errors Improve classification results Provide scientific validity to research 👉 Without accuracy assessment, a classified map is not considered scientifically reliable . Reference Data (Ground Truth Data) Reference data is real-world information used to check classification accuracy. It can be collected from: ✔ Field survey using GPS ✔ High-resolution satellite images (Google Earth etc.) ✔ Existing maps or survey reports 🧭 Exampl...

Development and scope of Environmental Geography and Recent concepts in environmental Geography

Environmental Geography studies the relationship between humans and nature in a spatial (place-based) way. It combines Physical Geography (natural processes) and Human Geography (human activities). A. Early Stage 🔹 Environmental Determinism Concept: Nature controls human life. Meaning: Climate, landforms, and soil decide how people live. Example: People in deserts (like Sahara Desert) live differently from people in fertile river valleys. 🔹 Possibilism Concept: Humans can modify nature. Meaning: Environment gives options, but humans make choices. Example: In dry areas like Rajasthan, people use irrigation to grow crops. 👉 In this stage, geography was mostly descriptive (explaining what exists). B. Evolution Stage (Mid-20th Century) Environmental problems increased due to: Industrialization Urbanization Deforestation Pollution Geographers started studying: Environmental degradation Resource management Human impact on ecosystems The field became analytical and problem-solving...

Change Detection

Change detection is the process of finding differences on the Earth's surface over time by comparing satellite images of the same area taken on different dates . After supervised classification , two classified maps (e.g., Year-1 and Year-2) are compared to identify land use / land cover changes .  Goal To detect where , what , and how much change has occurred To monitor urban growth, deforestation, floods, agriculture, etc.  Basic Concept Forest → Forest = No change Forest → Urban = Change detected Key Terminologies Multi-temporal images : Images of the same area at different times Post-classification comparison : Comparing two classified maps Change matrix : Table showing class-to-class change Change / No-change : Whether land cover remains same or different Main Methods Post-classification comparison – Most common and easy Image differencing – Subtract pixel values Image ratioing – Divide pixel values Deep learning methods – Advanced AI-based detection Examples Agricult...

History of GIS

1. 1832 - Early Spatial Analysis in Epidemiology:    - Charles Picquet creates a map in Paris detailing cholera deaths per 1,000 inhabitants.    - Utilizes halftone color gradients for visual representation. 2. 1854 - John Snow's Cholera Outbreak Analysis:    - Epidemiologist John Snow identifies cholera outbreak source in London using spatial analysis.    - Maps casualties' residences and nearby water sources to pinpoint the outbreak's origin. 3. Early 20th Century - Photozincography and Layered Mapping:    - Photozincography development allows maps to be split into layers for vegetation, water, etc.    - Introduction of layers, later a key feature in GIS, for separate printing plates. 4. Mid-20th Century - Computer Facilitation of Cartography:    - Waldo Tobler's 1959 publication details using computers for cartography.    - Computer hardware development, driven by nuclear weapon research, leads to broader mapping applications by early 1960s. 5. 1960 - Canada Geograph...

Isodata clustering

Iso Cluster Classification in Unsupervised Image Classification Iso Cluster Classification is a common unsupervised classification technique used in remote sensing. The "Iso Cluster" algorithm groups pixels with similar spectral characteristics into clusters, or spectral classes, based solely on the data's statistical properties. Unlike supervised classification, Iso Cluster classification doesn't require the analyst to predefine classes or training areas; instead, the algorithm analyzes the image data to find natural groupings of pixels. The analyst interprets these groups afterward to label them with meaningful information classes (e.g., water, forest, urban). How Iso Cluster Classification Works The Iso Cluster algorithm follows several steps to group pixels: Initial Data Analysis : The algorithm examines the entire dataset to understand the spectral distribution of the pixels across the spectral bands. Clustering Process :    - The algorithm starts by divid...