
Fuzzy classification in remote sensing

Fuzzy classification in remote sensing is a method of image classification that uses fuzzy logic to assign multiple class membership values to each pixel in an image. This approach allows for a more nuanced and accurate representation of the features present in the image, as it acknowledges the possibility of overlap and uncertainty in class boundaries. In a fuzzy classification, each pixel is assigned a set of membership values, or "fuzzy membership grades," that indicate the degree to which the pixel belongs to each class. These membership values can then be used to create a final, crisp classification of the image, or they can be used to represent the uncertainty of the classification.


Fuzzy membership grades in remote sensing refer to the degree to which a pixel in an image belongs to a particular class. In a fuzzy classification, each pixel is assigned a set of membership values, one for each class, that indicate the degree of class membership. These membership values are typically represented as a number between 0 and 1, with 0 indicating that the pixel does not belong to the class at all, and 1 indicating that the pixel fully belongs to the class.


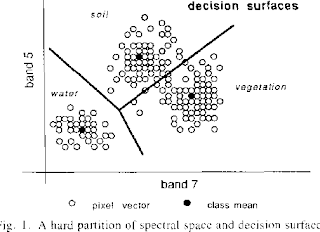
For example, a pixel with a membership value of 0.8 for class "forests" and a membership value of 0.2 for class "water" would indicate that the pixel is mostly covered by forest but with a small proportion of water. The membership values are calculated based on the pixel's characteristics, such as its spectral reflectance, texture, and spatial context, and are determined by comparing them to a set of predefined class prototypes. The final classification of the image can be done by finding the class with highest membership value for each pixel.


Fuzzy membership grades in remote sensing refer to the degree of membership of a particular pixel or feature in a specific class. In fuzzy logic, membership grades are used to represent the probability of a pixel or feature belonging to a specific class, rather than a traditional binary true or false value.


For example, in land cover classification, a pixel may have a membership grade of 0.8 for the class of "forest," meaning that it is 80% likely to be considered a forest. Similarly, a pixel may have a membership grade of 0.3 for the class of "agricultural land," meaning that it is 30% likely to be considered agricultural land.


These membership grades can be determined by comparing the pixel's spectral characteristics (such as its reflectance values) to the spectral characteristics of known examples of each class. For example, pixels with high reflectance values in the near infrared band are likely to be part of a forest and thus will have a high membership grade.


Fuzzy membership grades are useful in remote sensing because they allow for a more nuanced and accurate classification of the land cover. They take into account the uncertainty and ambiguity that can be present in the data, and allow for the consideration of multiple classes for a single pixel.


In addition, fuzzy membership grades can be used in change detection, where the membership grades from two or more images are compared to identify changes in the land cover. By comparing the membership grades, changes in land cover can be detected more accurately and accurately.


Overall, fuzzy membership grades are a powerful tool in remote sensing as they allow for a more accurate and nuanced analysis of the data. They are widely used in land cover classification, change detection and other applications in remote sensing.


Comments

Popular posts from this blog

REMOTE SENSING INDICES

Remote sensing indices are band ratios designed to highlight specific surface features (vegetation, soil, water, urban areas, snow, burned areas, etc.) using the spectral reflectance properties of the Earth's surface. They improve classification accuracy and environmental monitoring. 1. Vegetation Indices NDVI – Normalized Difference Vegetation Index Formula: (NIR – RED) / (NIR + RED) Concept: Vegetation reflects strongly in NIR and absorbs in RED due to chlorophyll. Measures: Vegetation greenness & health Uses: Agriculture, drought monitoring, biomass estimation EVI – Enhanced Vegetation Index Formula: G × (NIR – RED) / (NIR + C1×RED – C2×BLUE + L) Concept: Corrects for soil and atmospheric noise. Measures: Vegetation vigor in dense canopies Uses: Tropical rainforest mapping, high biomass regions GNDVI – Green Normalized Difference Vegetation Index Formula: (NIR – GREEN) / (NIR + GREEN) Concept: Uses Green instead of Red ...

Atmospheric Window

The atmospheric window in remote sensing refers to specific wavelength ranges within the electromagnetic spectrum that can pass through the Earth's atmosphere relatively unimpeded. These windows are crucial for remote sensing applications because they allow us to observe the Earth's surface and atmosphere without significant interference from the atmosphere's constituents. Key facts and concepts about atmospheric windows: Visible and Near-Infrared (VNIR) window: This window encompasses wavelengths from approximately 0. 4 to 1. 0 micrometers. It is ideal for observing vegetation, water bodies, and land cover types. Shortwave Infrared (SWIR) window: This window covers wavelengths from approximately 1. 0 to 3. 0 micrometers. It is particularly useful for detecting minerals, water content, and vegetation health. Mid-Infrared (MIR) window: This window spans wavelengths from approximately 3. 0 to 8. 0 micrometers. It is valuable for identifying various materials, incl...

Landsat band composition

Short-Wave Infrared (7, 6 4) The short-wave infrared band combination uses SWIR-2 (7), SWIR-1 (6), and red (4). This composite displays vegetation in shades of green. While darker shades of green indicate denser vegetation, sparse vegetation has lighter shades. Urban areas are blue and soils have various shades of brown. Agriculture (6, 5, 2) This band combination uses SWIR-1 (6), near-infrared (5), and blue (2). It's commonly used for crop monitoring because of the use of short-wave and near-infrared. Healthy vegetation appears dark green. But bare earth has a magenta hue. Geology (7, 6, 2) The geology band combination uses SWIR-2 (7), SWIR-1 (6), and blue (2). This band combination is particularly useful for identifying geological formations, lithology features, and faults. Bathymetric (4, 3, 1) The bathymetric band combination (4,3,1) uses the red (4), green (3), and coastal bands to peak into water. The coastal band is useful in coastal, bathymetric, and aerosol studies because...

Landsat 8 Band designation and Band Combination.

Landsat 8 Band designation and Band Combination.  Landsat 8-9 Operational Land Imager (OLI) and Thermal Infrared Sensor (TIRS) Bands Wavelength (micrometers) Resolution (meters) Band 1 - Coastal aerosol 0.43-0.45 30 Band 2 - Blue 0.45-0.51 30 Band 3 - Green 0.53-0.59 30 Band 4 - Red 0.64-0.67 30 Band 5 - Near Infrared (NIR) 0.85-0.88 30 Band 6 - SWIR 1 1.57-1.65 30 Band 7 - SWIR 2 2.11-2.29 30 Band 8 - Panchromatic 0.50-0.68 15 Band 9 - Cirrus 1.36-1.38 30 Band 10 - Thermal Infrared (TIRS) 1 10.6-11.19 100 Band 11 - Thermal Infrared (TIRS) 2 11.50-12.51 100 Vineesh V Assistant Professor of Geography, Directorate of Education, Government of Kerala. https://www.facebook.com/Applied.Geography http://geogisgeo.blogspot.com

Scattering

Scattering