

What is an Aquifer?
An aquifer is a body of saturated rock through which water can easily move. Aquifers must be both permeable and porous and include such rock types as sandstone, conglomerate, fractured limestone and unconsolidated sand and gravel. Fractured volcanic rocks such as columnar basalts also make good aquifers. The rubble zones between volcanic flows are generally both porous and permeable and make excellent aquifers. In order for a well to be productive, it must be drilled into an aquifer. Rocks such as granite and schist are generally poor aquifers because they have a very low porosity. However, if these rocks are highly fractured, they make good aquifers. A well is a hole drilled into the ground to penetrate an aquifer. Normally such water must be pumped to the surface. If water is pumped from a well faster than it is replenished, the water table is lowered and the well may go dry. When water is pumped from a well, the water table is generally lowered into a cone of depression at the well. Groundwater normally flows down the slope of the water table towards the well.
Is an Aquifer an Underground River?
No. Almost all aquifers are not rivers. Since water moves slowly through pore spaces in an aquifer's rock or sediment, the only life-forms that could enjoy floating such a 'river' would be bacteria or viruses which are small enough to fit through the pore spaces. True underground rivers are found only in cavernous rock formations where the rock surrounding cracks or fractures has been dissolved away to leave open channels through which water can move very rapidly, like a river.
Ground water has to squeeze through pore spaces of rock and sediment to move through an aquifer (the porosity of such aquifers make them good filters for natural purification. Because it takes effort to force water through tiny pores, ground water loses energy as it flows, leading to a decrease in hydraulic head in the direction of flow. Larger pore spaces usually have higher permeability, produce less energy loss, and therefore allow water to move more rapidly. For this reason, ground water can move rapidly over large distances in aquifers whose pore spaces are large (like the lower Portneuf River aquifer) or where porosity arises from interconnected fractures. Ground water moves very rapidly in fractured rock aquifers like the basalts of the eastern Snake River Plain. In such cases, the spread of contaminants can be difficult or impossible to prevent.
What does an aquifer look like?
Every aquifer is unique, although some are more generic than others. The boundaries of an aquifer are usually gradational into other aquifers, so that an aquifer can be part of an aquifer system. The top of an unconfined aquifer is the water table. A confined aquifer has at least one aquitard at its top and, if it is stacked with others, an aquitard at its base.
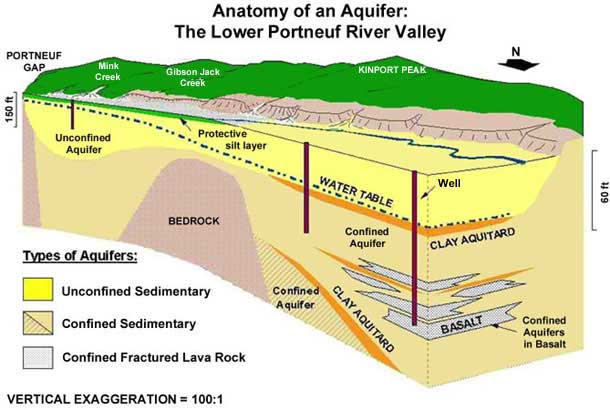 |
figure 1. Click on image for larger view. |
Figure 1 shows an example of an aquifer system in the lower Portneuf River valley. The diagram represents a cut-away perspective view of this system of multiple aquifers and is greatly exaggerated in its vertical scale to show some of the details. Several different aquifers occur in this valley. In the northern valley (beneath Chubbuck and north Pocatello) multiple confined aquifers are stacked on top of one another and separated by aquitards made of clay; the aquifers tapped by Chubbuck's municipal wells are in the fractured basalts of the eastern Snake River Plain. In the southern valley (Portneuf Gap to Red Hill) the upper surface of the unconfined aquifer is the water table.
How Does an Aquifer Work?
An aquifer is filled with moving water and the amount of water in storage in the aquifer can vary from season to season and year to year. Ground water may flow through an aquifer at a rate of 50 feet per year or 50 inches per century, depending on the permeability. But no matter how fast or slow, water will eventually discharge or leave an aquifer and must be replaced by new water to replenish or recharge the aquifer. Thus, every aquifer has a recharge zone or zones and a discharge zone or zones.
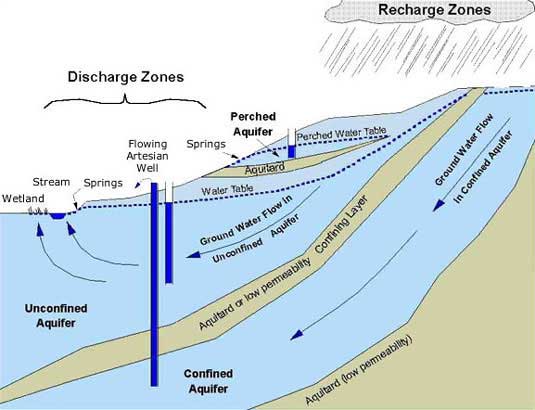 |
figure 2. Click on image for larger view. |
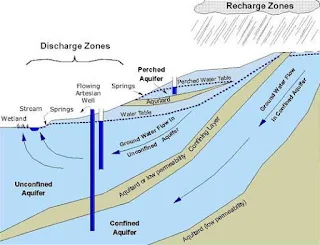
Figure 2 is a simple cartoon showing three different types of aquifers: confined, unconfined, and perched. Recharge zones are typically at higher altitudes but can occur wherever water enters an aquifer, such as from rain, snowmelt, river and reservoir leakage, or from irrigation. Discharge zones can occur anywhere; in the diagram, discharge occurs not only in springs near the stream and in wetlands at low altitude, and also from wells and high-altitude springs.
The amount of water in storage in an aquifer is reflected in the elevation of its water table. If the rate of recharge is less than the natural discharge rate plus well production, the water table will decline and the aquifer's storage will decrease. A perched aquifer's water table is usually highly sensitive to the amount of seasonal recharge so a perched aquifer typically can go dry in summers or during drought years.
Why is Groundwater So Clean?
Aquifers are natural filters that trap sediment and other particles (like bacteria) and provide natural purification of the ground water flowing through them.
Like a coffee filter, the pore spaces in an aquifer's rock or sediment purify ground water of particulate matter (the 'coffee grounds') but not of dissolved substances (the 'coffee'). Also, like any filter, if the pore sizes are too large, particles like bacteria can get through. This can be a problem in aquifers in fractured rock (like the Snake River Plain, or areas outside the sediment-filled valleys of southeast Idaho).
Clay particles and other mineral surfaces in an aquifer also can trap dissolved substances or at least slow them down so they don't move as fast as water percolating through the aquifer.
Natural filtration in soils is very important in recharge areas and in irrigated areas above unconfined aquifers, where water applied at the surface can percolate through the soil to the water table. For example, in the lower Portneuf River valley (Figure 1), a protective layer of silt in the southern valley provides natural protection to the aquifer from septic systems, pesticide application, and accidental chemical spills.
Despite natural purification, concentrations of some elements in ground water can be high in instances where the rocks and minerals of an aquifer contribute high concentrations of certain elements. In some cases, such as iron staining, health impacts due to high concentrations of dissolved iron are not a problem as much as the aesthetic quality of the drinking water supply. In other cases, where elements such as fluoride, uranium, or arsenic occur naturally in high concentrations, human health may be affected.
How is an Aquifer Contaminated?
As shown in Figure 3, an aquifer can be contaminated by many things we do at and near the surface of the earth. Contaminants reach the water table by any natural or manmade pathway along which water can flow from the surface to the aquifer.
Deliberate disposal of waste at point sources such as landfills, septic tanks, injection wells and storm drain wells can have an impact on the quality of ground water in an aquifer.
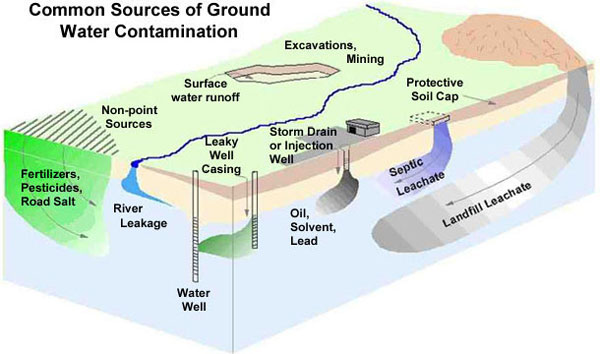 |
figure 3. Click on image for larger view. |
In general, any activity which creates a pathway that speeds the rate at which water can move from the surface to the water table has an impact. In , waste water leaking down the casing of a poorly constructed well bypasses the natural purification afforded by soil. Excessive addition of fertilizer, agrichemicals, and road de-icing chemicals over broad areas, coupled with the enhanced recharge from crops, golf courses and other irrigated land and along road ditches, are common reasons for contamination arising from non-point sources. Removal of soil in excavations and mining reduces the purification potential and also enhances recharge; in some cases, such as the Highway Pond gravel pits south of Pocatello, the water table is exposed and becomes directly vulnerable to the entry of contaminated.
Comments
Post a Comment