
Remote Sensing Resolutions

When we use satellites or drones to take pictures of the Earth, we talk about different types of "resolutions." These help us understand how clear, detailed, and frequent those pictures are. There are four main types:

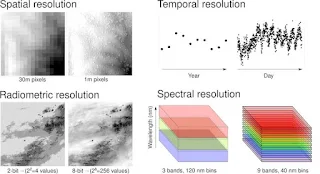
1. Spatial Resolution – How small can you see?

  • It tells us the size of the smallest object we can see in the image.

  • It depends on the pixel size. Smaller pixels = more detail.

  • Example: If the resolution is 10 meters, each pixel shows a 10m × 10m area on the ground.

  • Higher spatial resolution means you can see things like buildings and roads clearly.

🟩 Think of zooming in on Google Maps — more zoom = better spatial resolution.

2. Spectral Resolution – How many colours can you see?

  • It tells us how many types of light (or wavelengths) the sensor can detect.

  • Better spectral resolution means it can tell the difference between more materials (like water, soil, and vegetation).

  • It's like being able to see not just red, green, and blue — but also special colours we can't see with our eyes (like infrared).

🖼️ More spectral bands = better for identifying what's what in the image.

3. Radiometric Resolution – How many shades of brightness?

  • This tells us how sensitive the sensor is to light or energy.

  • It measures how many brightness levels the image can show.

  • Example: An 8-bit image can show 256 shades of grey, while a 16-bit image can show 65,536 shades!

🌓 Higher radiometric resolution = you can see finer differences in brightness, like shadows or slight color changes.

4. Temporal Resolution – How often are pictures taken?

  • This tells us how often the satellite passes over the same place and takes a new image.

  • Useful for monitoring changes — like how crops grow, how a city expands, or tracking floods.

  • Some satellites take images daily, others take them once every few days or weeks.

📅 Just like taking photos of a plant every day to see how it grows — that's good temporal resolution.


Resolution TypeMeaningExample/Use
SpatialSmallest detail visibleSeeing individual trees or houses
SpectralTypes of light/colors detectedTelling grass from water
RadiometricBrightness detailSeeing small changes in shade
TemporalHow often images are takenWatching a field grow over time


Comments

Popular posts from this blog

Geometric Correction

When satellite or aerial images are captured, they often contain distortions (errors in shape, scale, or position) caused by many factors — like Earth's curvature, satellite motion, terrain height (relief), or the Earth's rotation . These distortions make the image not properly aligned with real-world coordinates (latitude and longitude). 👉 Geometric correction is the process of removing these distortions so that every pixel in the image correctly represents its location on the Earth's surface. After geometric correction, the image becomes geographically referenced and can be used with maps and GIS data. Types  1. Systematic Correction Systematic errors are predictable and can be modeled mathematically. They occur due to the geometry and movement of the satellite sensor or the Earth. Common systematic distortions: Scan skew – due to the motion of the sensor as it scans the Earth. Mirror velocity variation – scanning mirror moves at a va...

RADIOMETRIC CORRECTION

  Radiometric correction is the process of removing sensor and environmental errors from satellite images so that the measured brightness values (Digital Numbers or DNs) truly represent the Earth's surface reflectance or radiance. In other words, it corrects for sensor defects, illumination differences, and atmospheric effects. 1. Detector Response Calibration Satellite sensors use multiple detectors to scan the Earth's surface. Sometimes, each detector responds slightly differently, causing distortions in the image. Calibration adjusts all detectors to respond uniformly. This includes: (a) De-Striping Problem: Sometimes images show light and dark vertical or horizontal stripes (banding). Caused by one or more detectors drifting away from their normal calibration — they record higher or lower values than others. Common in early Landsat MSS data. Effect: Every few lines (e.g., every 6th line) appear consistently brighter or darker. Soluti...

Atmospheric Correction

It is the process of removing the influence of the atmosphere from remotely sensed images so that the data accurately represent the true reflectance of Earth's surface . When a satellite sensor captures an image, the radiation reaching the sensor is affected by gases, water vapor, aerosols, and dust in the atmosphere. These factors scatter and absorb light, changing the brightness and color of the features seen in the image. Although these atmospheric effects are part of the recorded signal, they can distort surface reflectance values , especially when images are compared across different dates or sensors . Therefore, corrections are necessary to make data consistent and physically meaningful. 🔹 Why Do We Need Atmospheric Correction? To retrieve true surface reflectance – It separates the surface signal from atmospheric influence. To ensure comparability – Enables comparing images from different times, seasons, or sensors. To improve visual quality – Remo...

Supervised Classification

In the context of Remote Sensing (RS) and Digital Image Processing (DIP) , supervised classification is the process where an analyst defines "training sites" (Areas of Interest or ROIs) representing known land cover classes (e.g., Water, Forest, Urban). The computer then uses these training samples to teach an algorithm how to classify the rest of the image pixels. The algorithms used to classify these pixels are generally divided into two broad categories: Parametric and Nonparametric decision rules. Parametric Decision Rules These algorithms assume that the pixel values in the training data follow a specific statistical distribution—almost always the Gaussian (Normal) distribution (the "Bell Curve"). Key Concept: They model the data using statistical parameters: the Mean vector ( $\mu$ ) and the Covariance matrix ( $\Sigma$ ) . Analogy: Imagine trying to fit a smooth hill over your data points. If a new point lands high up on the hill, it belongs to that cl...

Pre During and Post Disaster

Disaster management is a structured approach aimed at reducing risks, responding effectively, and ensuring a swift recovery from disasters. It consists of three main phases: Pre-Disaster (Mitigation & Preparedness), During Disaster (Response), and Post-Disaster (Recovery). These phases involve various strategies, policies, and actions to protect lives, property, and the environment. Below is a breakdown of each phase with key concepts, terminologies, and examples. 1. Pre-Disaster Phase (Mitigation and Preparedness) Mitigation: This phase focuses on reducing the severity of a disaster by minimizing risks and vulnerabilities. It involves structural and non-structural measures. Hazard Identification: Recognizing potential natural and human-made hazards (e.g., earthquakes, floods, industrial accidents). Risk Assessment: Evaluating the probability and consequences of disasters using GIS, remote sensing, and historical data. Vulnerability Analysis: Identifying areas and p...