
Landsat band composition

Short-Wave Infrared (7, 6 4)

Landsat Shortwave Infrared

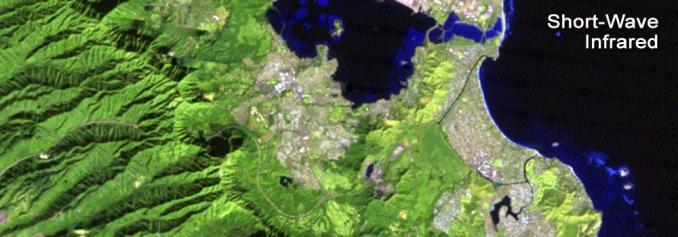
The short-wave infrared band combination uses SWIR-2 (7), SWIR-1 (6), and red (4). This composite displays vegetation in shades of green. While darker shades of green indicate denser vegetation, sparse vegetation has lighter shades. Urban areas are blue and soils have various shades of brown.


Agriculture (6, 5, 2)

Landsat Agriculture

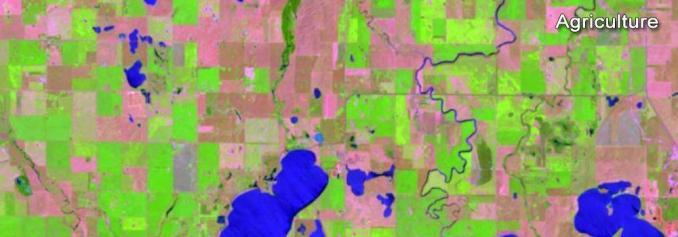
This band combination uses SWIR-1 (6), near-infrared (5), and blue (2). It's commonly used for crop monitoring because of the use of short-wave and near-infrared. Healthy vegetation appears dark green. But bare earth has a magenta hue.


Geology (7, 6, 2)

Landsat Geology

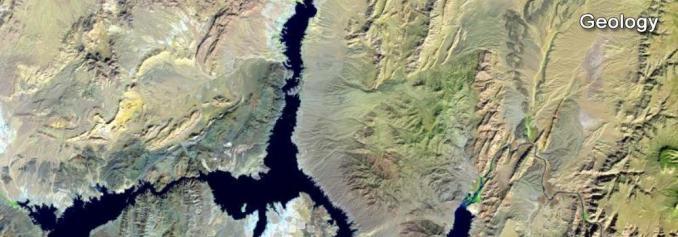
The geology band combination uses SWIR-2 (7), SWIR-1 (6), and blue (2). This band combination is particularly useful for identifying geological formations, lithology features, and faults.


Bathymetric (4, 3, 1)

Landsat Bathymetric

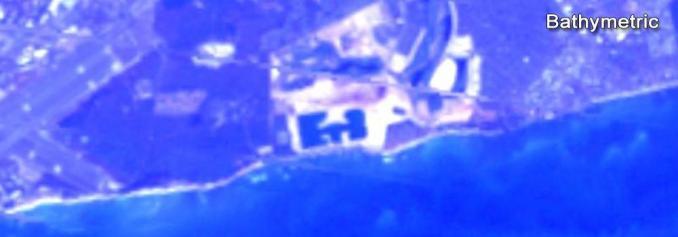
The bathymetric band combination (4,3,1) uses the red (4), green (3), and coastal bands to peak into water. The coastal band is useful in coastal, bathymetric, and aerosol studies because it reflects blues and violets. This band combination is good for estimating suspended sediment in the water.


Natural Color (4, 3, 2)

Landsat Natural Color

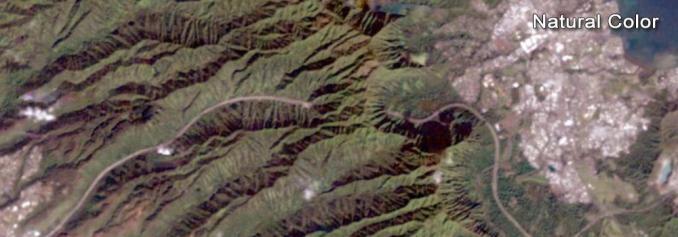
The natural color composite uses a band combination of red (4), green (3), and blue (2). It replicates close to what our human eyes can see. While healthy vegetation is green, unhealthy flora is brown. Urban features appear white and grey and water is dark blue or black.

Color Infrared (5, 4, 3)

Landsat Color Infrared

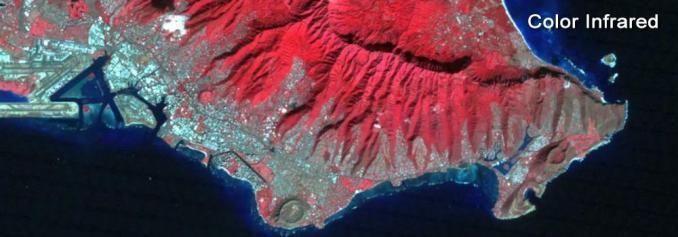
This band combination is also called the near-infrared (NIR) composite. It uses near-infrared (5), red (4), and green (3). Because chlorophyll reflects near-infrared light, this band composition is useful for analyzing vegetation. In particular, areas in red have better vegetation health. Dark areas are water and urban areas are white.

...


Comments

Popular posts from this blog

Supervised Classification

Image Classification in Remote Sensing Image classification in remote sensing involves categorizing pixels in an image into thematic classes to produce a map. This process is essential for land use and land cover mapping, environmental studies, and resource management. The two primary methods for classification are Supervised and Unsupervised Classification . Here's a breakdown of these methods and the key stages of image classification. 1. Types of Classification Supervised Classification In supervised classification, the analyst manually defines classes of interest (known as information classes ), such as "water," "urban," or "vegetation," and identifies training areas —sections of the image that are representative of these classes. Using these training areas, the algorithm learns the spectral characteristics of each class and applies them to classify the entire image. When to Use Supervised Classification:   - You have prior knowledge about the c...

Supervised Classification

In the context of Remote Sensing (RS) and Digital Image Processing (DIP) , supervised classification is the process where an analyst defines "training sites" (Areas of Interest or ROIs) representing known land cover classes (e.g., Water, Forest, Urban). The computer then uses these training samples to teach an algorithm how to classify the rest of the image pixels. The algorithms used to classify these pixels are generally divided into two broad categories: Parametric and Nonparametric decision rules. Parametric Decision Rules These algorithms assume that the pixel values in the training data follow a specific statistical distribution—almost always the Gaussian (Normal) distribution (the "Bell Curve"). Key Concept: They model the data using statistical parameters: the Mean vector ( $\mu$ ) and the Covariance matrix ( $\Sigma$ ) . Analogy: Imagine trying to fit a smooth hill over your data points. If a new point lands high up on the hill, it belongs to that cl...

Pre During and Post Disaster

Disaster management is a structured approach aimed at reducing risks, responding effectively, and ensuring a swift recovery from disasters. It consists of three main phases: Pre-Disaster (Mitigation & Preparedness), During Disaster (Response), and Post-Disaster (Recovery). These phases involve various strategies, policies, and actions to protect lives, property, and the environment. Below is a breakdown of each phase with key concepts, terminologies, and examples. 1. Pre-Disaster Phase (Mitigation and Preparedness) Mitigation: This phase focuses on reducing the severity of a disaster by minimizing risks and vulnerabilities. It involves structural and non-structural measures. Hazard Identification: Recognizing potential natural and human-made hazards (e.g., earthquakes, floods, industrial accidents). Risk Assessment: Evaluating the probability and consequences of disasters using GIS, remote sensing, and historical data. Vulnerability Analysis: Identifying areas and p...

History of GIS

The history of Geographic Information Systems (GIS) is rooted in early efforts to understand spatial relationships and patterns, long before the advent of digital computers. While modern GIS emerged in the mid-20th century with advances in computing, its conceptual foundations lie in cartography, spatial analysis, and thematic mapping. Early Roots of Spatial Analysis (Pre-1960s) One of the earliest documented applications of spatial analysis dates back to  1832 , when  Charles Picquet , a French geographer and cartographer, produced a cholera mortality map of Paris. In his report  Rapport sur la marche et les effets du choléra dans Paris et le département de la Seine , Picquet used graduated color shading to represent cholera deaths per 1,000 inhabitants across 48 districts. This work is widely regarded as an early example of choropleth mapping and thematic cartography applied to epidemiology. A landmark moment in the history of spatial analysis occurred in  1854 , when  John Snow  inv...

Atmospheric Correction

It is the process of removing the influence of the atmosphere from remotely sensed images so that the data accurately represent the true reflectance of Earth's surface . When a satellite sensor captures an image, the radiation reaching the sensor is affected by gases, water vapor, aerosols, and dust in the atmosphere. These factors scatter and absorb light, changing the brightness and color of the features seen in the image. Although these atmospheric effects are part of the recorded signal, they can distort surface reflectance values , especially when images are compared across different dates or sensors . Therefore, corrections are necessary to make data consistent and physically meaningful. 🔹 Why Do We Need Atmospheric Correction? To retrieve true surface reflectance – It separates the surface signal from atmospheric influence. To ensure comparability – Enables comparing images from different times, seasons, or sensors. To improve visual quality – Remo...