
8 bit and 16 bit image

In remote sensing, "eight-bit" and "sixteen-bit" refer to the number of bits used to represent the pixel values in an image. This affects the image's color or grayscale depth, which, in turn, influences the level of detail and precision in the image.


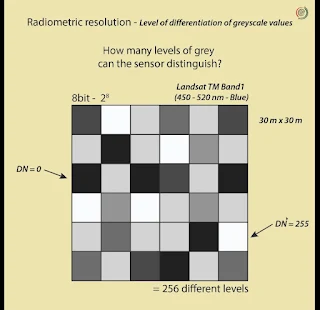
- Eight-Bit Image: An eight-bit image uses 8 bits per pixel to represent color or grayscale information. This means each pixel can have 2^8 (256) different possible values. In a grayscale eight-bit image, you have 256 shades of gray, ranging from black to white. In a color eight-bit image, you can represent a limited palette of 256 colors. Eight-bit images are suitable for basic visual interpretation but may lack fine detail and subtle color variations.


- Sixteen-Bit Image: A sixteen-bit image uses 16 bits per pixel, providing a significantly wider range of possible values, which is 2^16 (65,536). In remote sensing, sixteen-bit images are often used when high precision is required, especially in applications like land cover classification or analysis of subtle variations in terrain or vegetation. These images can represent a much broader range of colors or grayscale shades, making them ideal for detailed and accurate analysis.


In simple terms, the difference between eight-bit and sixteen-bit images in remote sensing is the level of detail and precision they offer. Sixteen-bit images can capture more information and nuances in the data, making them suitable for more advanced and accurate analysis, while eight-bit images are more basic and suitable for visual interpretation and simple applications.

Comments

Popular posts from this blog

History of GIS

1. 1832 - Early Spatial Analysis in Epidemiology:    - Charles Picquet creates a map in Paris detailing cholera deaths per 1,000 inhabitants.    - Utilizes halftone color gradients for visual representation. 2. 1854 - John Snow's Cholera Outbreak Analysis:    - Epidemiologist John Snow identifies cholera outbreak source in London using spatial analysis.    - Maps casualties' residences and nearby water sources to pinpoint the outbreak's origin. 3. Early 20th Century - Photozincography and Layered Mapping:    - Photozincography development allows maps to be split into layers for vegetation, water, etc.    - Introduction of layers, later a key feature in GIS, for separate printing plates. 4. Mid-20th Century - Computer Facilitation of Cartography:    - Waldo Tobler's 1959 publication details using computers for cartography.    - Computer hardware development, driven by nuclear weapon research, leads to broader mapping applications by early 1960s. 5. 1960 - Canada Geograph...

Supervised Classification

Image Classification in Remote Sensing Image classification in remote sensing involves categorizing pixels in an image into thematic classes to produce a map. This process is essential for land use and land cover mapping, environmental studies, and resource management. The two primary methods for classification are Supervised and Unsupervised Classification . Here's a breakdown of these methods and the key stages of image classification. 1. Types of Classification Supervised Classification In supervised classification, the analyst manually defines classes of interest (known as information classes ), such as "water," "urban," or "vegetation," and identifies training areas —sections of the image that are representative of these classes. Using these training areas, the algorithm learns the spectral characteristics of each class and applies them to classify the entire image. When to Use Supervised Classification:   - You have prior knowledge about the c...

History of GIS

The history of Geographic Information Systems (GIS) is rooted in early efforts to understand spatial relationships and patterns, long before the advent of digital computers. While modern GIS emerged in the mid-20th century with advances in computing, its conceptual foundations lie in cartography, spatial analysis, and thematic mapping. Early Roots of Spatial Analysis (Pre-1960s) One of the earliest documented applications of spatial analysis dates back to  1832 , when  Charles Picquet , a French geographer and cartographer, produced a cholera mortality map of Paris. In his report  Rapport sur la marche et les effets du cholĂ©ra dans Paris et le dĂ©partement de la Seine , Picquet used graduated color shading to represent cholera deaths per 1,000 inhabitants across 48 districts. This work is widely regarded as an early example of choropleth mapping and thematic cartography applied to epidemiology. A landmark moment in the history of spatial analysis occurred in  1854 , when  John Snow  inv...

Representation of Spatial and Temporal Relationships

In GIS, spatial and temporal relationships allow the integration of location (the "where") and time (the "when") to analyze phenomena across space and time. This combination is fundamental to studying dynamic processes such as urban growth, land-use changes, or natural disasters. Key Concepts and Terminologies Geographic Coordinates : Define the position of features on Earth using latitude, longitude, or other coordinate systems. Example: A building's location can be represented as (11.6994° N, 76.0773° E). Timestamp : Represents the temporal aspect of data, such as the date or time a phenomenon was observed. Example: A landslide occurrence recorded on 30/07/2024 . Spatial and Temporal Relationships : Describes how features relate in space and time. These relationships can be: Spatial : Topological (e.g., "intersects"), directional (e.g., "north of"), or proximity-based (e.g., "near"). Temporal : Sequential (e....

Pre During and Post Disaster

Disaster management is a structured approach aimed at reducing risks, responding effectively, and ensuring a swift recovery from disasters. It consists of three main phases: Pre-Disaster (Mitigation & Preparedness), During Disaster (Response), and Post-Disaster (Recovery). These phases involve various strategies, policies, and actions to protect lives, property, and the environment. Below is a breakdown of each phase with key concepts, terminologies, and examples. 1. Pre-Disaster Phase (Mitigation and Preparedness) Mitigation: This phase focuses on reducing the severity of a disaster by minimizing risks and vulnerabilities. It involves structural and non-structural measures. Hazard Identification: Recognizing potential natural and human-made hazards (e.g., earthquakes, floods, industrial accidents). Risk Assessment: Evaluating the probability and consequences of disasters using GIS, remote sensing, and historical data. Vulnerability Analysis: Identifying areas and p...